 |
Monday, November 1, 2010
Stocks Of Filinvest Land Preparing To Climb Again?
Wednesday, October 27, 2010
DMC Stocks Up 1,950% In 2 Years!

Hi everyone, that’s right! The title states it clearly! Before, I mentioned the stocks of JG Summit Holdings gaining 1,600% in less than 2 years from 1.58 pesos to an all-time high of 27.00 pesos (kindly see this link)
Monday, October 18, 2010
Oriental Peninsula Resources Group To Make Another Move?

Wednesday, October 6, 2010
JGS Stocks Gained 1600% In Less Than 2 Years!

Hello, that's right guys. The title speaks for itself! The stocks of JG Summit Holdings, Inc. or JGS as listed in the Philippine Stock Exchange shot up more than 1600% in less than 2 years. By the way, for those who do not know, this company is involved in air transportation, banking, food manufacturing,
Tuesday, September 21, 2010
PSEi Still on a High!

Hallo stock traders! It's been more than a week since the main index of the Philippine Stock Exchange (PSEi) has passed above its all-time high of 3,896.74 and if you want to check my post on that last September 9 , kindly click here. Looking at its chart now, we can see it has moved pass above the 4,000.00 psychological resistance when it still hasn't last week. It was also able to make a new all-time high of 4,125.50 when it hit the 2-year ascending channel's resistance during the previous trading session. If the PSEi decides to further ascend, the immediate resistance could be the 4,125.50 all-time high. If that price mark gets cleared out, the next could be the 2-year ascending channel's resistance. On the downside, in case the index follows a correction, the immediate support could be the 4,000.00 psychological level. If it further drops below that marker, the next support could be 3,896.74.
A few hours ago, the data on the U.S. housing starts surged a better-than-expected 10.5% in August to a seasonally adjusted annual rate of 598,000. This could continue to boost traders confidence and add optimism on the global markets.
Sunday, September 19, 2010
Phoenix Petroleum Technical Analysis Update

Tuesday, September 14, 2010
FLI High!

Thursday, September 9, 2010
Hello PSEi All-time High!!!

Hello beautiful people! Let's get back the to the chart of the Philippine Stock Exchange Index (PSEi). The last time I posted on this was last month (kindly see it here) and back then, the ascending channel was still intact (indicated by the yellow parallel lines). Two weeks ago however, the index cleared out the ascending channel's resistance and surged higher. Then, in just six trading days, it moved past above the 3667.74, 3770.18 and the 3896.74 resistances. I actually just noticed now the PSEi has already doubled its value in less than two years after coming from the bear market. Also, a few minutes ago, the US reported a decline in unemployment claims, from 472k previously to 451k now which brings the US market sentiments towards the positive side. This could be good for the global economy including the Philippine Stock Exchange as the US economy is still a benchmark for the global market.
Technically speaking, what is ahead of the Philippine Stock Exchange Index? Like I mentioned earlier, the PSEi has breached the 3,896.74 resistance (this would still be the all-time high if not for today's bullish session) and could head higher as there are no more resistances left. However, there could still be some selling pressure at the 4,000.00 psychological level which I personally consider a resistance. If that gets taken out, the PSEi could just shoot all the way up again until it finds some resistance around 4,100. In my opinion, the break above the 3,896.74 resistance isn't convincing as there is no significant surge in the volume. The index could slightly decline before it heads back on track but who knows right. There are many cases on breakouts without much volume but still went all the way up. Aside from that, the volume is just a secondary indicator next to the price action (price is still king). Anyway, on the pessimist's point of view, if the index suddenly drops, the former resistances could act as supports. If not, the 18-month uptrend could be the strongest support among them all and like I always mention, as long as the uptrend remains intact, the northbound direction of this index will most likely continue. Enjoy the long weekend guys, let's see what happens on Monday. Cheers!
Friday, September 3, 2010
The Ayala Corporation Breakout!

Hello stock traders! It's been a while since I last posted on Ayala Corporation or AC in the Philippine Stock Exchange. If you want to check my post three months ago, kindly check here. As you could see, it took 5 months for the Ayala Corporation stocks to setup the triangle formation that could trigger the break above the 355.00-357.50 peso 2-year resistance area. Fortunately, it did on September 2 which is just yesterday (indicated by the yellow circle). Right now, the Ayala stocks could further head up but could encounter some selling pressure at the 400.00 peso psychological area which I also consider a resistance. However, if the stocks move past above the 400.00 peso marker, the next resistance could be 422.50 pesos. On the downside, in case the stocks start to drop, it could bounce off the 355.00-357.50 peso resistance-turned-support. If it slips and slides below that area, the next support could be the 7-month uptrend.
Yesterday, the US reported a great news on their Pending Home Sales data as it turned out to be positive. Currently, they also reported a stability on the unemployment rate which triggered the Dow Jones Industrial Average and the other major indices to stay on the bullish territory, well at least for now. Since the US market's with the bulls right now, the Philippine market will most likely be as well on the coming Monday trading session. Good news for the blues! Happy weekend guys, cheers!
Thursday, August 26, 2010
Updates on the Phoenix Petroleum Stocks

As the Phoenix Petroleum stocks continue to move within the 8.00 peso resistance and the 19-month uptrend, they are going to lose their breathing space as those levels are about to intersect in a few months. Thus, the stocks could just either move past above that 8.00 peso marker or dive below the the 19-month uptrend. In case it breaks above the 8.00 peso resistance, the next one could be 8.70 pesos. On the other hand, if the stocks drop below the 19-month uptrend, the next area of support is 6.80-7.00 pesos. If the stocks continue to decline and clear out the 6.80-7.00 peso level, the next support could be 6.50 pesos.
Wednesday, August 18, 2010
The ABS-CBN Run!

The ABS-CBN Corporation or ABS in the Philippine Stock Exchange is one of the top TV station network in the Philippines. They are the country's first and largest integrated media and entertainment company. The last time I posted my technical analysis of its stock chart was three months ago and many price movements have taken place since then.
Back in my last post on this Lopez owned company (kindly check here), the 9-year resistance line was still intact and the stock value was still at 36.50 pesos. Based on the stock chart now, the stocks broke out from the 38.50 peso 9-year resistance a months ago (indicated by the red circle) and made a new 9-year high of 54.40 pesos the past few days. A nice 40% gain in less than a month would have been bagged if you bought at the breakout point and sold at 54.00 pesos. Definitely not bad at all! If the ABS-CBN stocks successfully clear out the 54.40 peso price mark, it could aim for the next resistance at 56.50 pesos. Then the next resistance after that is 67.00 pesos. On the downside, if the stocks fall, it could find some support at the 50.00 peso psychological area. If it further falls below that level, the next support could be 44.50 pesos.
Monday, August 16, 2010
FLI Profits!

Hello there! Here's an update of my technical analysis on Filinvest Land, Inc. (FLI in the Philippine Stock Exchange) that I posted two weeks ago (kindly check here). The last time I posted about FLI stocks, they were still trying to breakout from the triangle formation by consolidating and going in and out of the resistance level. Fortunately, they were able to fully breakout and made a 2-year high of 1.18 pesos. Once the 1.18 peso price mark gets cleared out, the next resistance that could be aimed for is 1.33 pesos which is the base of the triangle added up to the breakout point (red circle). However, the stocks went back down and found some support at 1.04 pesos. If the stocks breach below the 1.04 peso marker, the next support could be the 1-peso psychological area.
Word on the street, Filinvest Land Inc. launched five new projects to meet the demands for residential properties. At the same time, they bagged a good 2nd quarter 2010 net income of 31 percent or 998 million pesos compared to 759 million pesos during the same period last year. This in turn propelled their stocks to rise 2.8% to 1.10 pesos during the trading session earlier.
Wednesday, August 11, 2010
Nihao Breaks Out?

Monday, August 2, 2010
Sunday, August 1, 2010
Philippine Stock Pick: Filinvest Land Inc. - August 1, 2010

PSEi Weekend Update - August 1, 2010

Sunday, July 25, 2010
Phoenix Petroleum Breaks Out? - July 25, 2010

Wednesday, July 14, 2010
PSEi Breaks Out of the Channel - July 14, 2010

Sunday, July 11, 2010
PSEi Weekend Wrap-Up - July 11, 2010

Friday, July 2, 2010
Philippine Stock Exchange Index: PSEI – July 2, 2010

In the chart of the Philippine Stock Exchange Index, the price is currently moving within the uptrend and the 3,360.00-3,380.00 resistance levels. As a result, if it continues to do so, the price will no longer have space to move further unless it breaks above the 3,360.00-3,380.00 resistance or break down from the uptrend. If the current resistance gets cleared out, 3,667.74 could be the next price mark. On the downside, if the uptrend gets broken, the next support could be 3,219.46. Like what I always say about uptrends, as long as the uptrend remains intact I'd stay along side with the bulls.
Tuesday, June 22, 2010
Philippine Stock Exchange Index: PSEi - June 22, 2010

Friday, June 18, 2010
Philippine Stocks: PNX (Phoenix Petroleum Philippines, Inc.) - June 18, 2010

Wednesday, June 16, 2010
Philippine Stocks: FLI (Filinvest Land, Inc.) – June 17, 2010

Friday, June 11, 2010
Philippine Stocks: COL (Citiseconline.com, Inc.) – June 11, 2010

Sunday, June 6, 2010
Philippine Stock Exchange Index: PSEI – June 6, 2010
 The PSEi (Philippine Stock Exchange Index) has broken above the 2-year resistance line at 3,333.26 during last Friday’s trading session. This break could propel the value of the index to the next resistance at 3,514.74. However, with the Dow Jones Industrial Average’s 3% decline during last Friday’s US session due to a weak employment number and a threat of a sovereign default by Hungary, I doubt that the PSEi could push higher tomorrow. In fact, I’m more convinced that the Philippine Stock Exchange Index would turn around and decline towards its uptrend’s support. If the uptrend line fails to hold, the index could slip to somewhere between 3,073.71 and 3093.88.
Thursday, June 3, 2010
PHILIPPINE STOCKS: SMCB (SAN MIGUEL CORPORATION “B”) – June 3, 2010

Sunday, May 30, 2010
Philippine Stocks: AC (Ayala Corporation) – May 30, 2010

Thursday, May 20, 2010
PHILIPPINE STOCKS: PAX (PAXYS, INC.) – May 20, 2010

Back in my last post on Paxys Inc. or PAX as listed in the Philippine Stock Exchange, it had just broken down from the symmetrical triangle formation when the price broke below the 2.16 level (yellow circle). Now, it looks to be nearing my target price of 1.82 as it had dropped to 1.86 yesterday. In case 1.82 won’t be reached, at the current price of 1.88 yields a 12% gain already if you were able to short sell at 2.14… not bad at all.
It looks like Paxys stocks is still facing the south as the price moves below the downtrend’s resistance line (indicated by the blue line). However, the current support line (greed dotted line) looks to be tough enough to holding on to 1.82 but if it does not, the price can fall to 1.43 which is the next support line (yellow dotted line). On the other hand, if the price breaks above the downtrend’s resistance line, it can head to the 2.3-2.4 area which is where I see the next significant resistance (violet dotted line) is at.
Wednesday, May 19, 2010
PHILIPPINE STOCKS: ABS (ABS-CBN BRODCASTING CORPORATION) – May 19, 2010
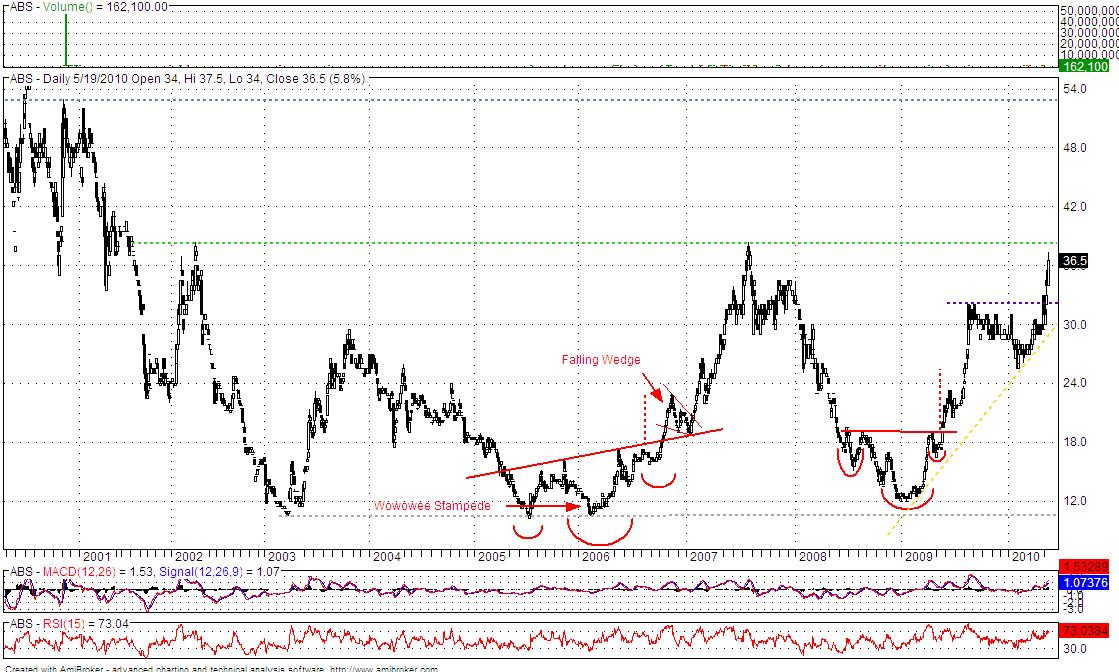
Despite the majority stocks in the Philippine Stock Exchange dropped today, ABS-CBN stocks gained 5.8% bringing it closer to the 9-year resistance line at 38.5 (green dotted line). There is a 1-year uptrend (yellow dotted lines) in the ABS-CBN chart which brought the price from 12 pesos to the current value of 36.5 pesos per share.
For the mean time the trading range I’m looking at is from 32-38.5. A break above 38.5 will be significant since that’s the major resistance level. If it breaks below 32 pesos (violet dotted line), you still have the 1-year uptrend’s support (yellow dotted lines).
Monday, May 17, 2010
PHILIPPINE STOCKS: REPUBLIC CEMENT CORPORATION – May 17, 2010

Friday, May 14, 2010
PHILIPPINE STOCKS: CPM (CENTURY PEAK METALS HOLDINGS CORP.) – May 14, 2010

When Century Peak Metals Holdings Corporation was publicly listed in the Philippine Stock Exchange as CPM last October of 2009, it went from 1.5 to 7 pesos per share in a couple of months then the price broke down from its uptrend (dotted violet line) declining to around 3 pesos per share. It took a month after the downtrend ended as the stock price broke out from the downtrend’s resistance line (green dotted line) back in February of 2010. From there on, it started moving sideways and currently, not much action is taking place in CPM aside from the 3.1-3.8 trading range (indicated by the red lines) but if a break from the range occurs, that’s a different story.
PHILIPPINE STOCKS: ORE (ORIENTAL PENINSULA RESOURCES GROUP, INC) – May 13, 2010

Wednesday, May 12, 2010
PHILIPPINE STOCKS: ALI (AYALA LAND, INC.) – May 12, 2010

Chart-wise, the price of Ayala Land stocks (ALI) is currently in an upward trading channel (blue dotted lines) after coming from the 2007-2009 downtrend (violet dotted line). From October of 2008 to August of 2009, ALI started moving sideways and broke out (orange circle) from the consolidation’s resistance (orange line) on August 24, 2009. From that breakout point, the price consolidated for another 7 months until it broke out (red circle) from its resistance line (red line) on March 30, 2010. Currently, the price again looks to have been consolidating for a month now and I’m looking into 12.75 as the support (red line) and 14.25 as the resistance (greed dotted line).
Tuesday, May 11, 2010
PHILIPPINE STOCKS: AC (AYALA CORPORATION) – May 11, 2010

Monday, May 10, 2010
PHILIPPINE STOCK EXCHANGE INDEX: PSEI - May 10, 2010

The current resistance line (green dotted line) is around 3,330 as seen in the chart. We may be seeing the PSEi's value moving just within the resistance and support lines in the following weeks unless the European market worsens due to the the current financial crisis in Greece. If more drastic downswings are followed up by the major markets, the uptrend will most likely be taken out and the PSEi brought lower.
Tuesday, May 4, 2010
PHILIPPINE STOCKS: ORE (ORIENTAL PENINSULA RESOURCES GROUP, INC) 5-4-2010

Saturday, May 1, 2010
PHILIPPINE STOCKS: RCB (RIZAL COMMERCIAL BANKING) 5-1-2010

Tuesday, April 27, 2010

Sunday, April 25, 2010
PHILIPPINE STOCKS: EDC (ENERGY DEVELOPMENT CORPORATION) 4-25-2010

It has been more than 3 years since Energy Development Corporation or EDC has been publicly listed in the Philippine Stock Exchange as seen in the chart on the left. EDC’s stock value had been climbing from its listing date until November of 2007 and declining during the whole year of 2008. 2009 was a different story as it bottomed out, breaking loose from its downtrend (indicated by the violet dotted line), bottomed out and now moving in an upward trading channel (indicated by the blue dotted parallel lines) up to present. In addition to that, we are also seeing an ascending triangle w/in the upward trading channel. Once the price successfully breaks out from the resistance at 5.3, we might be seeing the stock price of Energy Development Corp. hitting 5.9 pesos in short time.
For personal finance:
Compare Credit Cards
Cheap Unsecured Loans
Consolidate Your Debt
Friday, April 23, 2010
PHILIPPINE STOCKS: PAX (PAXYS, INC) 4-23-2010

PAXYS, INC. or PAX as listed in the Philippine Stock Exchange was still consolidating the symmetrical triangle formation last week. Now, it has broken down from the said formation (indicated by the yellow circle) after the Friday trading session. Let's see if it reaches my target price of 1.82 pesos per share.
PSEPICKS is BACK!!!
PSEpicks has decided to post technical analysis of Philippine stocks once again. Whatever analysis will be posted here will also be posted in LaidTrades.com.
Saturday, February 13, 2010
PSEPICKS now moves to LaidTrades.com
Psepicks will no longer be updated here since we have now moved to www.LaidTrades.com. All updates will be seen in www.LaidTrades.com (",)
Saturday, December 26, 2009
PHILIPPINE STOCKS: PNX (PHOENIX PETROLEUM PHILIPPINES INC.) 12-26-2009

Phoenix Petroleum has broken out of the major resistance line (green dotted line), indicated by the red circle, as seen in its stock chart. A sudden increase in its stock value will be highly anticipated. Merry Christmas!
Saturday, December 12, 2009
PHILIPPINE STOCK EXCHANGE INDEX: PSEI 12-12-2009

In the chart of the Philippine Stock Exchange index (PSEi), we currently have here a 4-month upward trading range (indicated by the red diagonal lines). As long as the range remains intact, the index is still bound to rise.
Tuesday, December 8, 2009
PHILIPPINE STOCKS: LIHC (LODESTAR INVESTMENT HOLDINGS CORPORATION) 12-8-2009

LIHC has broken out of a major resistance line. The upside looks bright!
Monday, November 23, 2009

Sunday, November 15, 2009
PHILIPPINE STOCKS: MUSX (MUSX CORPORATION) 11-15-2009

MUSX seemed to have broken out last Thursday morning but went back in its area pattern the next day as the US market dropped Thursday night (Manila time). Still, it can bounce back up anytime soon! Click image to enlarge!
Thursday, November 12, 2009
PHILIPPINE STOCKS: BDO (BANCO DE ORO UNIBANK, INC.) 11-12-2009

BDO has broken out of it's ascending triangle formation as it gapped up during the opening of today's trading session. Click to see previous post about BDO.
Tuesday, November 10, 2009
PHILIPPINE STOCKS: BDO (BANCO DE ORO UNIBANK, INC.) 11-10-2009

The ascending triangle formation on the chart of BDO was still premature during my last post on it since it was just forming. Now, it looked like to have set up a better ascending triangle (indicated by the horizontal and diagonal line) and more likely to breakout soon. The price to break is at 36.5 and once it does with heavy volume, an easy 41 pesos per share will be achieved. Click image to enlarge!
Friday, October 30, 2009
PHILIPPINE STOCKS: MER (MANILA ELECTRIC COMPANY) 10-30-2009

As a request from a finance dude who happens to be the author of this blog cianoyinthephilippinestockmarket.blogspot.com/, I have posted my technical insights on the stock charts of 3 blue chips, particularly Meralco, PLDT and San Miguel Corporation. The one-year time frame of Meralco stock chart shows the uptrend is still intact (PLDT and San Miguel are on seperated posts, scroll down to view it) since the price hasn't gone below the support line (purple dotted diagonal line) however there seems to be a descend in price from the previous trading days (indicated by the green dotted diagonal line). A break in the support line is possible or a bounce back up. The stock price moving sideways should also be considered. Looking at the MACD on the other hand, there is a weakness shown as a crossover is made between the red and blue line (indicated by the red circle). Personally, I won't touch this stock as of the moment or if I do my cut loss will be set below the support line. Click image to enlarge!
Subscribe to:
Posts (Atom)